|
|
|
|
|
|
|
Do you want to be a better CNC'er in 37 Seconds? Get Better Tool Life, Surface Finish, and Material Removal Rates Fast. It's that easy. You can install and get results now. |
 |
Running the GWE G-Code Simulator |
How Do I Test My G-Code Programs Without Crashing My Machine?
By now you've come along quite a ways. You're able to control your CNC using MDI as though it were a manual machine with DRO's and Power Feeds on every axis. You understand the basic G-Codes for motion and how to construct a line of g-code with sequence numbers and all the rest. You're ready to start creating more complex programs that get beyond what you might try to do on the fly with MDI. Perhaps you have a CAM program that's generating g-code and you're itching to try it out.
How do you know the program isn't going to crash the cutter into your workpiece, or worse an expensive vise or your machine's table?
Your first order of priority in solving this problem is to make sure you get part zero set up properly, and that you're able to run the machine "cutting air" with one hand on the feedrate override. That means you will intentionally make part zero sit high above the part so that unless there is a severe error in your program, the cutter will never get close to anything but air. You'll use the feedrate override to run the machine very slowly through the program while it is cutting the air.
Being able to cut air is a great diagnostic tool to have, and until you're absolutely sure of your skills in setting up the program's part zero and dealing with different tool lengths, you'll want to be sure to carefully check each program you run by cutting air.
Cutting Air is Slow. Is there a better way to diagnose my G-Code Programs?
Cutting Air can be extremely slow, and it uses valuable machine time that might otherwise be employed doing something productive like making chips. Once you're facile cutting air, and you know how to set up your machine with the proper part zero and deal with tool length offsets, you're going to get tired of cutting air and be wishing for a faster way to check your programs. The answer to this problem is that you'll want to use a G-Code Simulator, such as CNCCookbook's own G-Wizard Editor.
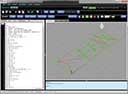
A good simulator will show you what's called a Backplot of your program. Here is a typical backplot of the g-code programs we have available for download and experimentation:
A backplot of a program to engrave a CNC connector panel...
The red and green lines are showing you the motion of the tip of the cutter on this mill program. Red lines are for rapids: G0 movement. Green lines are for feed motion: G01 for straightlines and G02/03 for arcs. It's pretty easy to tell from the backplot whether there is some errant motion that will slam the tool tip down too far, for example.
Doesn't my CAM Program already have a Backplot for this purpose?
The qualified answer is, "Maybe." The issue is how the CAM program's backplot is generated. If your CAM program includes a true CNC g-code simulator, then yes, it does have a simulated backplot and by all means use it. The thing is, most CAM programs don't. They just plot the same geometry information that was used to create the g-code output by the postprocessor. This allows for subtle bugs to creep in that are not detectable in the CAM backplot. Because of that, a lot of experienced machinists insist on a separate simulated backplot as a sanity check for their g-code before they'll run it. It doesn't cost very much or take very long to have this peace of mind, so it's something you should consider.
Single Stepping to Understand the G-Code Better
A good simulator can do a lot more than just display a backplot; it can run through the program step by step and show you a great deal of information about what's going on. With GWE, a set of buttons similar to what is found on your CNC is used to control the simulation:
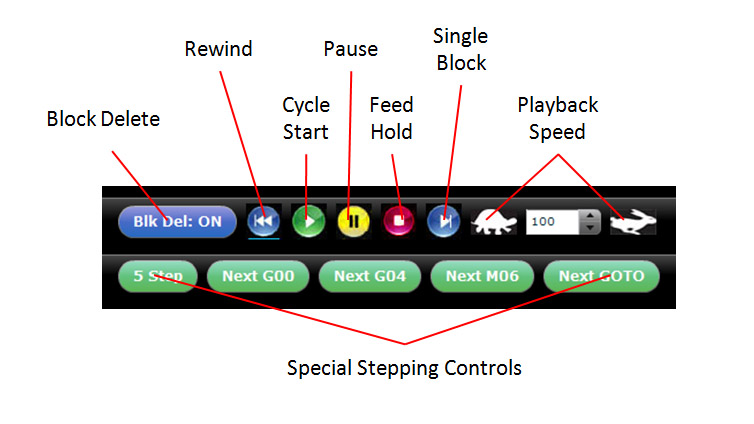
Simulator Controls...
To start a simulation, press the "Rewind" followed by "Cycle Start". You can control playback speed as a percentage of maximum with the Playback Speed controls. The Tortoise makes it run slow, the Hare makes it run fast and you can change the percentage as well. If you want to step through block by block, turn on the "Single Block" button. It will turn red to signify it is active. To exit the simulator and show only the finished Backplot, just press "Feed Hold".
Using these controls you can go through your program block by block. The "Special Stepping Controls" give you the ability to move ahead to points of interest more quickly:
- "5-Step" causes 5 blocks at a time to execute in Single Block mode instead of just one at a time. You can change the number of blocks this button will execute via the Simulator Options menu.
- "Next G00" moves the simulation ahead to the next G00. Often a g-code program will alternate between cutting moves and G00 moves to position for the next cut, so this is a convenient way to move forward.
- "Next G04" moves the simulator ahead to the next Dwell (G04). Why is that helpful? Dwells can be inserted almost anywhere in a program without causing a problem, so insert a Dwell in a place you want to be able to go to easily while debugging your program and use this button to get there quickly.
- "Next M06" moves the simulator ahead to the next Toolchange.
- "Next GOTO" moves the simulator ahead to the next place where the program jumps to a subroutine or block number. It's handy if you're trying to debug macros.
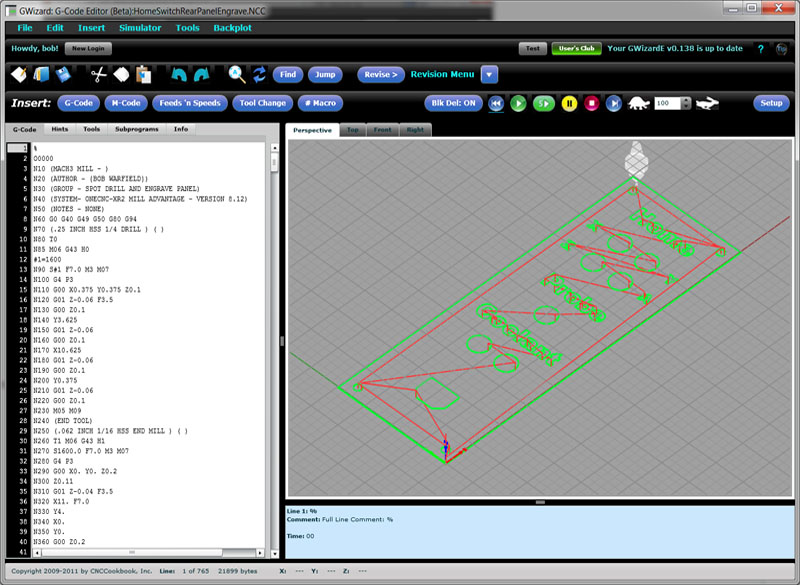
Simulator Screen Areas
When the Simulator is running, GWE displays quite a lot of additional information in a variety of screen areas:
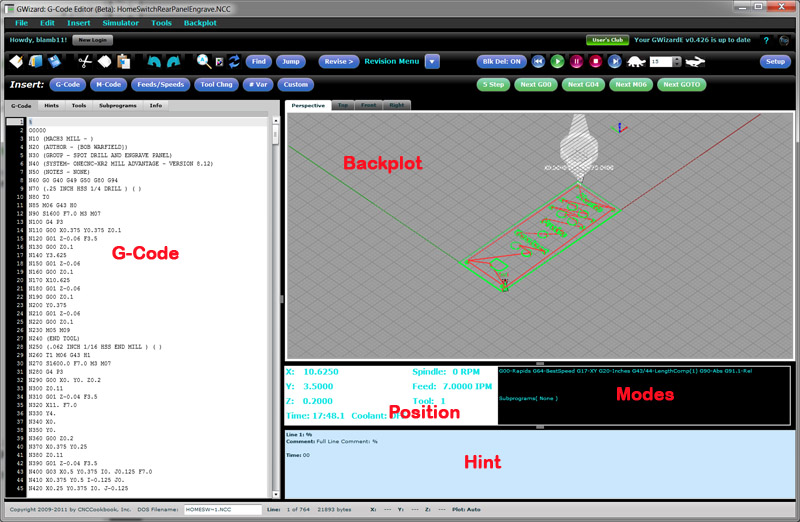
Simulator screen areas labeled in red...
Each screen area is called out in the illustration above in red. Here is the function of each:
G-Code
This area shows you the g-code. The line being executed is highlighted. The illustration shows the very top line highlighted. If you click on this pane, GWE will offer to stop the simulation so you can edit the code.
Backplot
This shows you the backplot of the moves made up to the currently executing line.
Position
Position is like the position display on your machine controller. It's showing you the X, Y, and Z coordinates, the Spindle RPM, the Feedrate, the current Tool, the Coolant status, and the time the program has run.
Modes
Modes tells you all the modal states of the controller. For example, is some work offset active? It also tells you the last few #variables that changed and what the values were that they changed to.
Hint
The Hint tells you in plain English what the g-code for the current line is expected to do. It also gives you a lot of other information that may not be obvious just looking at the program such as where an arc's center is located.
Conclusion
Using a simulator like G-Wizard Editor makes it much easier for you to tell by looking at the backplot whether the program is apt to make sudden moves outside the expected work envelope. It also helps you go through the program step-by-step and see what it's doing.
Exercises
1. Experiment on your machine cutting air to make sure you're familiar with how to set that up and use it as a diagnostic tool.
2. Run several CAM generated posts through a G-Code Simulator like G-Wizard Editor. How do the backplots compare to those produced within your CAM program?
3. Try single block mode to simulate some g-code programs. Follow what's updating in each of the screen areas as you step through.
Try the Free Trial Version of G-Wizard G-Code Editor...
![]()
No credit card required--just your name and email.
Next Article: Tool Changes and Tool Offsets
|
Do you want to be a better CNC'er in 37 Seconds? Get Better Tool Life, Surface Finish, and Material Removal Rates Fast. It's that easy. You can install and get results now.
|
||||||||||||||||||
| ||||||||||||||||||